Introduction
Inferior Vena Cava (IVC) is the largest vein in the body. It is formed by the confluence of the left and right common iliac veins at the level of L5 vertebra. It runs cephalad all the way to the right atrium. The IVC generally runs along the right side of the spine. Be aware that the abdominal aorta also runs parallel to the IVC just left to the IVC. Do not confuse IVC with abdominal aorta while scanning. You may consider tracking it all the way cephalad to the right atrium or even assessing the flow in it with spectral Doppler to determine if it is a venous waveform.
IVC also acts like a venous capacitance reservoir. The IVC becomes intrahepatic and receives blood from the liver via the right, middle and left hepatic veins just before it dumps the blood into the right atrium. On the way through the liver, it also receives blood from the renal and other smaller veins. This anatomical detail is important to understand why changes in volume status and venous pressures can have an impact on hemodynamics in the liver and kidneys.
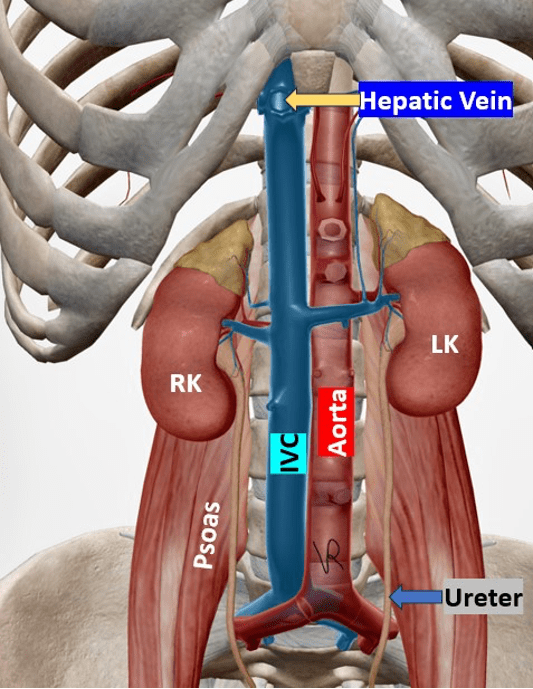
Figure 1. IVC seen on the right of the midline. Observe that the renal veins and hepatic veins drain blood into it as it travels cephalad to the right atrium.
The IVC carries deoxygenated blood to the right atrium from the lower body. The IVC assessment for volume status in Point-of-Care ultrasound (POCUS) has become an established and invaluable tool in all hospitalized patients including critical care and emergency medicine. Even in general medicine inpatients, it would be recommended to observe the IVC daily to make sure there is nothing abnormal happening in the IVC status.
This non-invasive bedside ultrasound technique provides rapid, real-time information that can guide clinical decision-making in fluid management. Keep in mind that in very sick patients and complex hemodynamics situations such as cardiorenal syndrome the IVC assessment may not be enough to get a clear picture. However, those situations are not as common and, in those situations, we should obtain a full picture by performing a VExUS protocol and lung ultrasound.
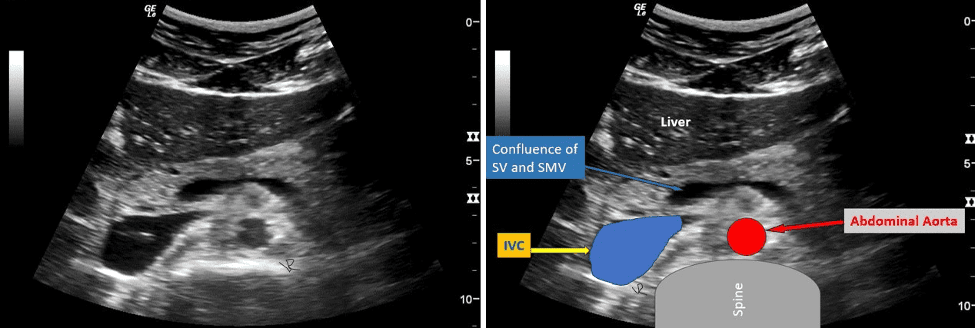
Figure 2. The image on the left shows an axial view through the left lobe of the liver and the pancreas. Observe the location of the IVC. The image on the right is the same image with the labels. Note the location of the abdominal aorta (red). This image will help you understand the location of the IVC relative to the spine and the abdominal aorta. When trying to identify the IVC during ultrasound examination locate the echogenic spine with a posterior acoustic shadow. Then, locate the IVC and abdominal aorta relatively anterior to it. This process makes identifying IVC easy and reliable. Do not confuse the confluence of the splenic vein (SV) with the superior mesenteric vein (SMV). See image on the right.
Clinical Applications
IVC assessment in the POCUS setting can assist with the following.
- Evaluating volume status in hypovolemic shock patients
- Guiding fluid resuscitation
- Assessing fluid responsiveness
- Monitoring patients with heart failure
IVC Assessment for Volume Status Assessment
It is recommended to use a low-frequency transducer to assess the IVC. I prefer to use a low frequency curvilinear transducer due to its wide field of view. However, some experts use a phased array low frequency transducer. The phased array low frequency transducer should be used as a backup alternative. Each of the above-mentioned transducers have their own unique pros and cons. Place the transducer in the subxiphoid region with the transducer orientation marker pointing cephalad. The IVC is a retroperitoneal vessel. The abdomen preset is recommended for scanning the IVC.
You may encounter some images with cardiac preset and the IVC appearing flipped with the image orientation marker on the right side of the image. That is not recommended because those are cardiac preset parameters. But it is not a bid deal if you can orient your mind to it. Slide the transducer slightly towards the right of the patient. If the right atrium (RA) is not visible, slide the transducer cephalad (towards the patient’s head) to obtain a view of the IVC draining into the right atrium. Measure the IVC diameter 2 cm distal to the right atrial-IVC junction by placing an M-mode cursor at that level. Document and measure IVC respiratory variation using M-mode as shown in Figure 3.
IVC Diameter Variation Measurement and Interpretation
IVC diameter < 2.1 cm with > 50% collapse suggests normal or low right atrial pressure.
IVC diameter > 2.1 cm with < 50% collapse suggests elevated right atrial pressure.
Always consider the full clinical picture. There was a world cycling champion whose IVC was surprisingly close to 3.5 cm and showed more than 50% inspiratory collapse. He just happened to have a large venous reserve. That was normal for him.
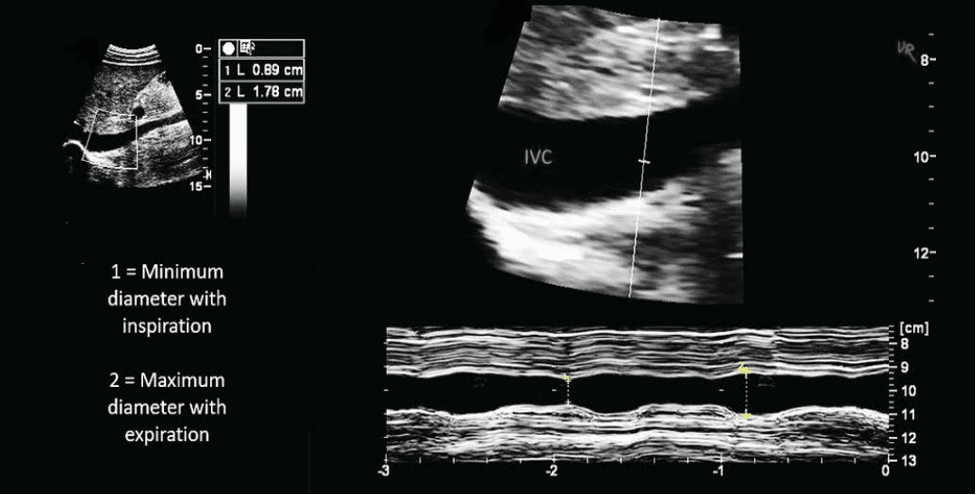
Figure 3. IVC diameter variation assessment using M-mode. Maximum IVC diameter is 1.78 cm and showed almost 50% collapse with inspiration. This is normal. The IVC is zoomed in so it may give a false impression of a dilated IVC (optical illusion).
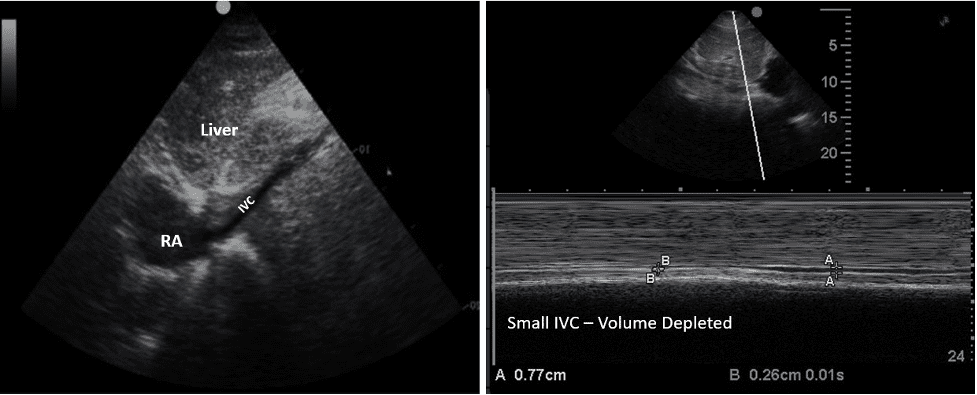
Figure 4. Small IVC (volume depleted).
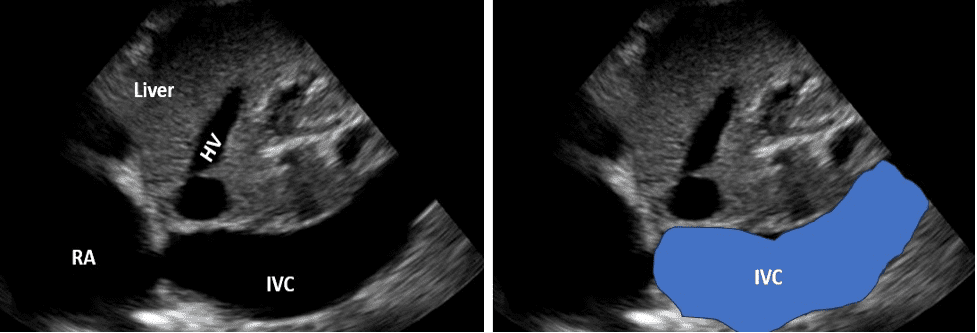
Figure 5. Plethoric IVC. Hepatic vein and right atrium (RA) are also dilated.
IVC Collapsibility Index (CI)
(IVC Max−IVC Min) / IVC Max × 100% (IVC Max−IVC Min)/IVC Max×100%
The CI had a sensitivity and specificity of 71% and 81% respectively according to pooled data from two studies for non-mechanically ventilated patients. The IVC diameter variation with respiration was seen to be greater in patients who are fluid responsive. Patients with lower IVC collapsibility index are possibly more likely to tolerate ultrafiltration with hemodialysis or improve cardiac output with ultrafiltration according to a study.
IVC Diameter, Variability with Respiration and Approximate CVP
The table below shows the relationship between IVC diameter, respiratory variation, and approximate CVP range. The extreme ends are more important to note and are highlighted in yellow. However, use judiciously.
| IVC diameter (cm) | Respiratory variation | CVP (cm H20) |
| <1.5 | Total collapse or >50% | 0-5 |
| 1.5 – 2.5 | >50% | 6-10 |
| 1.5 – 2.5 | <50% | 11-15 |
| >2.5 | <50% | 16-20 |
| >2.5 | No change | >20 |
Table 1. IVC diameter and respiratory variation and corresponding approximate central venous pressure (CVP).
Limitations
While IVC assessment is helpful, it’s important to be aware of its limitations. Certain factors like body habitus and increased intra-abdominal pressure can affect IVC diameter measurements. Respiratory effort and mechanical ventilation can also affect IVC hemodynamics. The right heart function can impact IVC appearance independent of volume status. Complex hemodynamics may require VExUS protocol assessment to manage the patient effectively.
Final Thoughts
IVC assessment using POCUS is an important bedside tool for evaluating volume status, but it should be interpreted in conjunction with other clinical parameters. As with all ultrasound techniques, proper training and understanding of its limitations of IVC assessment are crucial for accurate interpretation and clinical application. Make sure it is truly IVC and not the abdominal aorta. Lung ultrasound performed with IVC assessment may provide a more accurate assessment of intravascular and extravascular volume and can help avoid extreme hypervolemia in patients.
The hope is that every POCUS user will be able to use this valuable tool confidently. IVC assessment is for everyone, and you can use it to effectively manage a wide spectrum of patients. A patient in shock with a responsive IVC is probably going to respond better to intravenous fluid administration as compared to a dilated plethoric non-responsive IVC.
References
- https://www.ncbi.nlm.nih.gov/pmc/articles/PMC6649212/
- https://pubmed.ncbi.nlm.nih.gov/33477143/
- https://www.ncbi.nlm.nih.gov/pmc/articles/PMC10053997/
- https://academic.oup.com/ckj/article/16/11/1861/7210550
- https://www.ebmedicine.net/topics/cardiovascular/symptomatic-hypotension
- https://pubmed.ncbi.nlm.nih.gov/34906306/